We often hear market analysts or experienced traders talking about an equity price nearing a certain support or resistance level, each of which is important because it represents a point at which a major price movement is expected to occur. But how do these analysts and professional traders come up with these so-called levels? One of the most common methods is using pivot points, and here we take a look at how to calculate and interpret these technical tools.
How to Calculate Pivot Points
There are several different methods for calculating pivot points, the most common of which is the five-point system. This system uses the previous day's high, low and close, along with two support levels and two resistance levels (totaling five price points) to derive a pivot point. The equations are as follows:
R2 = P + (H - L) = P + (R1 - S1)
R1 = (P x 2) - L
P = (H + L + C) / 3
S1 = (P x 2) - H
S2 = P - (H - L) = P - (R1 - S1)
Here, "S" represents the support levels, "R" the resistance levels and "P" the pivot point. High, low and close are represented by the "H", "L" and "C" respectively. Note that the high, low and close in 24-hour markets (such as forex) are often calculated using New York closing time (4pm EST) on a 24-hour cycle. Limited markets (such as the NYSE) simply use the high, low and close from the day's standard trading hours.
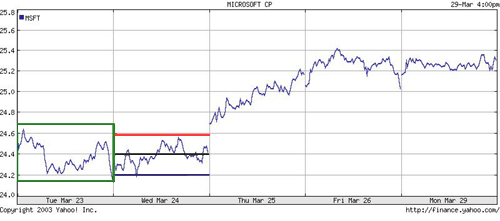
Take a look at the following example of the five-point system, which illustrates a projection of Microsoft's (Nasdaq:MSFT) stock movement. Note the pivot point and the support and resistance levels.
 |
| Source: Yahoo! Finance |
Another common variation of the five-point system is the inclusion of the opening price in the formula:
P = ((Today's O) + Yesterday's (H + L + C)) / 4
Here, the opening price, "O", is added to the equation. Note that the opening price for foreign exchange markets is simply the last period's closing price. The supports and resistances can then be calculated in the same manner as the five-point system, except with the use of the modified pivot point.
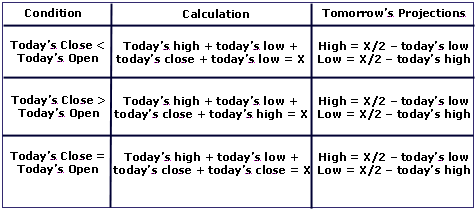
Yet another pivot point system was developed by Tom DeMark, a famous technical analyst and president of Market Studies, Inc. This system uses the following rules:
 |
As you can see, there are many different pivot-point systems available. Some popular ones include as many as nine different price levels; meanwhile, others predict only one pivot point, and no additional levels of support or resistance.
Interpreting and Using Pivot Points
When calculating pivot points, the pivot point itself is the primary support/resistance. This means that the largest price movement is expected to occur at this price. The other support and resistance levels are less influential, but may still generate significant price movements.
Pivot points can be used in two ways. The first way is for determining overall market trend: if the pivot point price is broken in an upward movement, then the market is bullish, and vice versa. Keep in mind, however, that pivot points are short-term trend indicators, useful for only one day until they need to be recalculated. The second method is to use pivot point price levels to enter and exit the markets. For example, a trader might put in a limit order to buy 100 shares if the price breaks a resistance level. Alternatively, a trader might set a stop-loss for his active trade if a support level is broken.
Conclusion
Pivot points are yet another useful tool that can be added to any trader's toolbox. It enables anyone to quickly calculate levels that are likely to cause price movement. The success of a pivot-point system, however, lies squarely on the shoulders of the trader, and on his or her ability to effectively use the pivot-point systems in conjunction with other forms of technical analysis. These other technical indicators can be anything from MACD crossovers to candlestick patterns - the greater the number of positive indications, the greater the chances for success.
No comments:
Post a Comment